Quarterly Market Review: Q1 2024
By: Paul Dickson, Director of Research and Giri Krishnan, Senior Portfolio Manager
Could there be “no landing” for the U.S. Economy?
In defiance of the expectations of many economists, the U.S. Economy continues to show remarkable resiliency. The surprisingly strong economy of 2023 appears poised to continue into 2024, pushing back forecasts for Federal Reserve rate cuts. This raises expectations that 2024 could avoid a significant slowdown altogether. If the eventual end of this business cycle is extended much further, pundits will claim it as evidence of a soft-landing, which is the growing consensus for the outlook. Could we be in store for a once-in-a-generation “no landing” scenario, akin to that which occurred in the mid-1990s? While that sounds like a good thing, it could portend other problems.
The base case for the economic outlook is that inflation continues to trend lower, the economy slows modestly, unemployment increases meaningfully but not
tragically, and the Federal Reserve (Fed) reacts with a series of interest rate cuts leading to a “soft-landing”. This would entail a slowdown in economic growth,
but no recession. No one is certain how much the economy would need to slow to “land,” and it is unclear how continued above trend growth might be characterized. It may be that there is no landing in sight, as unlikely as that sounds.
Economic tailwinds from 2023’s remarkable performance seem to have propelled activity in the first quarter. The Atlanta Fed’s GDPNow1 forecast has a growth estimate of 2.8% for the first three months of the year, following an impressive 3.4% in the final quarter of 2023. Such a pace of growth is significantly above estimates of a natural rate of 1.8%, which we will touch on later. The economy remains buoyed by very strong consumer spending, above trend investment, and consistent fiscal boosts. These factors made last year one of the strongest in quite some time. While there are some signs of consumer stress, these have yet to become a dominant theme. The overall pace of activity is quite robust. This has led to speculation that the Fed will delay rate cuts until late in the year. More than one high ranking Fed official has speculated that there is a growing chance that there might be no rate cuts at all in 2024.
Echoes of the 1990s
In many ways, the economy resembles that of the mid-1990s, when the Federal Reserve hiked interest rates in the face of a robust recovery from the 1990-1991 recession, but did not spark a recession. Usually, the business cycle goes through a period of growth. This sparks inflation that is met with Fed rate hikes until the economy falls into recession, bringing inflation back down. As illustrated in the chart, this has been a pattern for many years. It was only interrupted once during the remarkable economy of the mid-1990s. Over that period, the Fed hiked rates in response to rising growth and succeeded in curbing a rising inflationary trend, but did not push the economy into recession. Rather, the economy remained robust through the end of the decade, only succumbing to the stock market crash of the early 2000s.
Up With People
There are several theories about how the economy of the 1990s fared so well. Some cite the “peace dividend” following the collapse of the Soviet Union and the realignment of government spending. The advent of the internet undeniably spurred significant investment. However, the big productivity gains stemming from it were still years away. Another theory lies in demographic factors. In the mid-90s, the Baby Boom Generation, the largest at that time, was in the prime of their working lives in their 30s and 40s. So, too, today are most Millennials, now the largest generation in U.S. history. This likely helps to explain the sharp post-pandemic recovery. The pent-up demand of so many 30-somethings, having been unable to spend much during lockdown and having just received stimulus checks, was unleashed into an economy ill-prepared for it. It also helps explain why other countries have lagged. China’s population is falling and in Europe, the largest age cohort is older, with their Millennials never having overtaken the region’s Boomers.
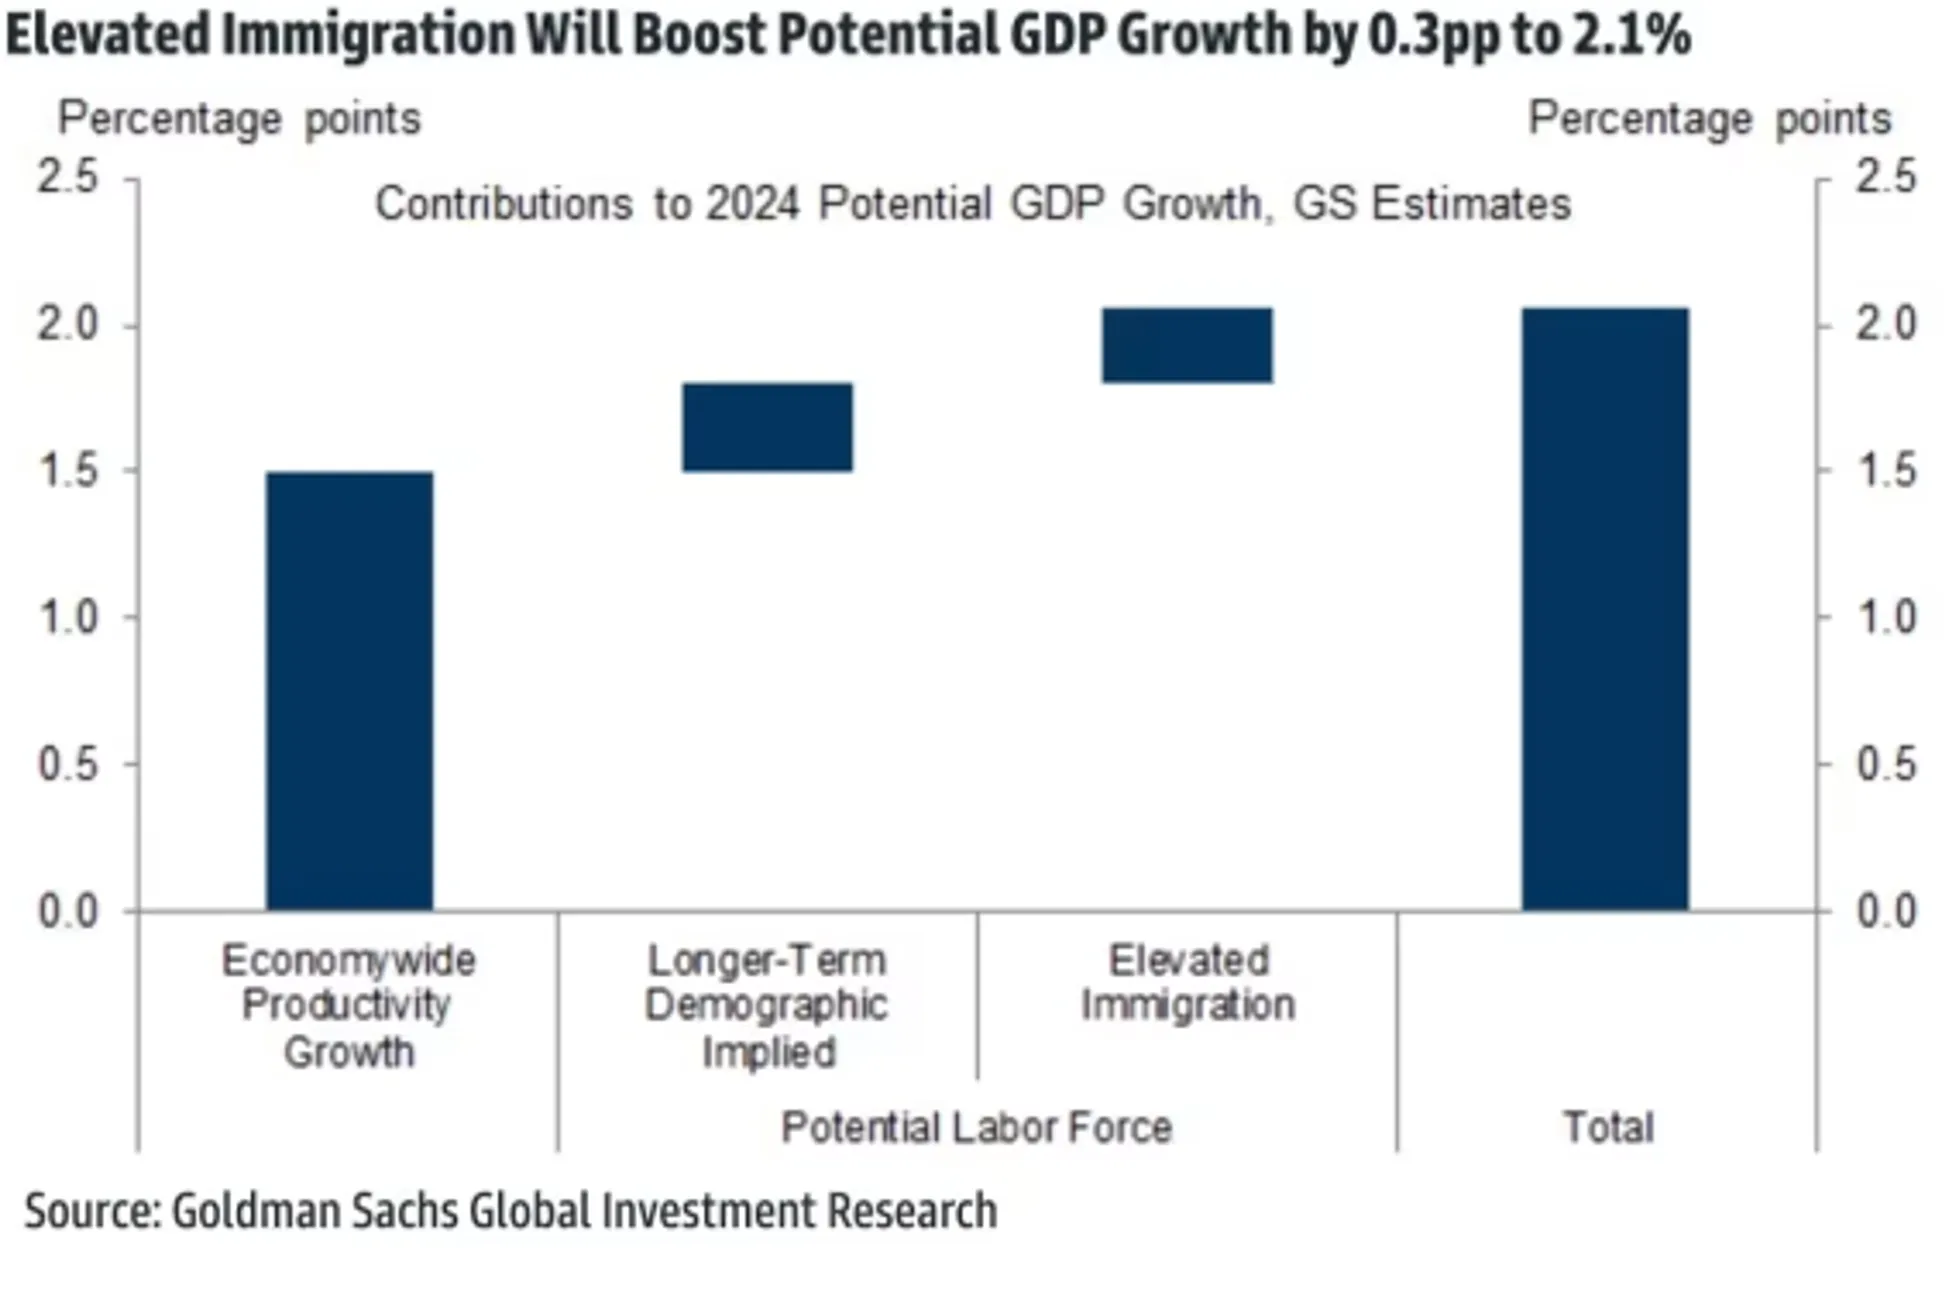
Another demographic tailwind has been the post-pandemic recovery in immigration. Just as in the 1990s, immigration has recently surged and appears to explain the ongoing surprises with labor force growth. Payroll growth has tended to outpace the median projections of economists surveyed. This rise in the number of workers has helped to keep the unemployment rate below 4.0% and, in fact, saw a decline to 3.8% in March from 3.9% the month before.
This increase in the labor force has increased the economy’s capacity for growth. Goldman Sachs recently published a study in which they estimate that the recent rise in immigration has added 0.3% to economic growth, which is quite significant.
“AI” as the new “dot-com”?
Another source of exuberance and a driver of economic activity and investment is the advent of Artificial Intelligence (AI), which promises to infiltrate large portions of the economy with promises of significant productivity gains. Equity markets have rewarded the leaders in the AI space with tremendous valuations and gains on shares. And, while it is likely that AI will deliver on many of its promises, there is always the risk that adoption or at least pseudo-adoption of the technology will fail to live up to the hype. In the meantime, the economy does get a boost from the “wealth effect” of rising share prices in which consumers’ improved balance sheets provide impetus for higher spending.
This was the case in the “dot-com” bubble of the late 1990s, where just staking an online presence and adding “.com” to a company name meant significant upside speculation. Ultimately, much of this failed to live up to the hype. In the meantime, however, that bubble energized “animal spirits” and propelled spending and investments significantly before over-extending and ultimately crashing. While it is far too early to forecast such a fate for the current AI craze, mal- or mis- investments are always a risk with anything new and untested. The winners of tomorrow might not even be the well-known
names of today. However, given the concentration in research and development and the sheer dominance of the tech giants, history might not repeat itself and the gains may well be captured by the current leaders.
As a segue into our market discussion, consider the following charts. For quite some time, the performance of the U.S. equity markets has been dominated by
a selection of very large names. The top 10 stocks, of which the “Magnificent 7” are the lion’s share, constitute almost a third of the value of the index. They have dominated the overall returns of the market, never more so than since the end of 2022. Much of the excitement over this tech-heavy group is the promise that they will benefit the most from, and possibly dominate, advances in AI. NVIDIA from its specialized silicon chip production; the software and online giants from the application of AI in their products and services. This dominance of returns may continue for some time, but it is likely to end at some point.
This brings us to the following chart. The green areas are periods of market outperformance as weighed by market cap in which the largest companies have the greatest impact. The grey areas are when those largest ones either decline or the smaller components start to catch up. While it is impossible to time, it is another reason for portfolio diversification.
Markets In 2024 – Global Economic Picture Improving, U.S. Market Breadth Expanding
2024 began with better prospects for the economy and markets than in the prior year, but with a higher performance bar on the back of a strong finish to 2023. At the start of the year, consensus expectations called for a slowing in economic growth, a modestly better lending environment for businesses, a more cash-strapped consumer that had depleted a chunk of their post-pandemic savings, persistent geopolitical risks but also an improving fundamental picture worldwide. One notable missing headwind from the prior year was U.S. monetary policy. The Federal Reserve made it abundantly clear during its December Federal Open Market Committee meeting that it saw inflation under control (but not fully out of the woods yet). Correspondingly, the market’s expectation for multiple rate cuts in 2024 fueled 2023’s year-end rally.
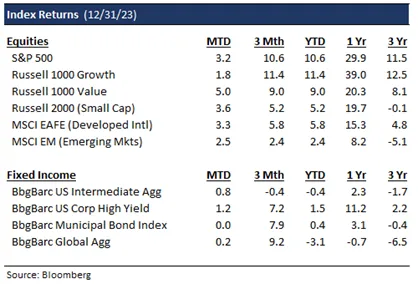
Through the first quarter, 2024 S&P 500 returns have largely followed a similar cadence as prior Presidential election years. Typically, markets rally in the first half of an election year, become choppier during the months heading into the elections, and rally into year-end once election outcomes are clear.Through the end of the first quarter, the S&P 500 was up a healthy 10%+ but the composition of the rally is different from 2024. While half of the “Magnificent 7,” including Apple and Tesla, had largely underperformed, a lot of beaten-down sectors (e.g. Energy, Financials) played catch up. With U.S. GDP growth hovering between 2-3% and corporate earnings growth again trending positive, cyclical sectors (e.g.: Industrials, Materials) have done well alongside growth-oriented sectors like Technology. Developed and emerging markets have collectively lagged the S&P 500’s performance, up 6% and 2%, with the latter weighed down by China’s economic malaise yet again. On the other hand, most fixed income sectors started the year off slow, with both the U.S. and Global Aggregate bond returns negative for the year through March.
What’s Ahead: A Likely Soft or No Landing, Much (Generally Misplaced) Angst Regarding Elections, Higher Volatility and a Fed Rate Cut (or two)
Consistent with then-prevailing consensus market view at the start of 2024, year-to-date (YTD) positive returns across most equity sectors (U.S. and International) have reflected a continuation of bullish investor sentiment from the end of last year through the end of March. Broadly, market expectations called for a modestly positive (low to mid-single-digit return) year for U.S. stocks. With the expectation for Federal Reserve rate cuts, bonds are projected to have a good year after their toughest two-year stretch in decades. So far this year, economic indicators such as Global Purchasing Managers (PMI) indices, GDP growth, and employment numbers have been bullish and not indicative of an imminent recession. Even traditionally reliable recessionary indicators, such as the inverted yield curve, which normally foreshadow a recession within an 18-month period, have not been a reliable harbinger of bad news given that we have now had an inverted yield curve for nearly 24 months. In fact, over the past few months, the yield curve has un-inverted a bit as markets have begun to price in the impact of future rate cuts. If one assumes that the current bull market in equities began in October of 2022, that would put its current length at 17 months. This would match the median bull market duration going as far back as the 1920s. Given the non-participation of nearly 50% of the Magnificent 7 in this year’s rally, the 2024 equity market momentum has been encouraging since other sectors have been catching up.
Historically, the fourth year of a U.S. Presidential cycle has seen the second highest returns for the S&P 500, with the index up ~75% of the time and posting an average 7.5% return. Some notable exceptions are 2000 (which saw the end of the dot-com boom) and 2008 (when we had the great financial crisis). If history is any guide, U.S. markets trend lower in the few months leading up to the election before reversing course in the 12 months after the election. Given that the markets rightfully expected a Trump vs. Biden candidacy, the only wildcard political outcome that would surprise is a win by an independent candidate. Despite political influences being at the forefront of our clients' minds, it is essential to note that our investment decisions are not swayed by potential election results. Historical data indicates that the U.S. equity market returns over a 10-year period from the beginning of an election year remain remarkably consistent, irrespective of which political party, Democrats or Republicans, takes office.
Also, the cliché ‘don’t fight the Fed’ should aid rather than hinder market performance in 2024 unless any rate cuts put in place are done so primarily to ward off a steep economic downturn OR if we get rate hikes instead due to a resurgence in inflation. Based on the ongoing 25+ month stretch of unemployment readings below 4% and a modest recent pick up in inflation, the former appears farther away than originally thought. Typically, the Fed pauses at least ten months between the last rate hike and the first rate cut, which implies a first rate cut in June or July. March’s Federal Reserve meeting featured Chairman Jerome Powell’s confirmation that the Fed was indeed looking to cut rates thrice in 2024. This follows a string of recent PCE readings that indicated inflation was under control but still quite a ways from the Fed’s 2% target. After a nearly two-year stretch (that ended in December) of obsessing over how many potential rate hikes were needed to curb inflation, we have reached a juncture where investors are now trying to gauge how many rate cuts will occur in 2024. The Fed’s dot plot contemplates three rate hikes, although there is now a higher probability that the first rate cut will be in July (and not June). The market seems to be coming around to this view after pricing in 6-7 rate cuts at the start of 2024. In addition, the Fed sharply revised its 2024 GDP projection to 2.1% (from 1.4%) and lowered its unemployment rate forecast modestly to 4%.
Correspondingly, investor sentiment on stocks has also turned bullish. The latest American Association of Individual Investors (AAII) survey showed that over 47% of investors expect stock prices to rise over the next six months, while only 22% expect stock prices to fall. This would be 10% and 9% points above and below historical averages, respectively. Both bond and stock market activity have tracked this sentiment lately, with the MOVE and VIX indices (gauges of U.S. interest rate and S&P 500 market volatility) declining since October, and this investor complacency implies higher volatility later in the year.
Portfolio Implications – Core Bonds Appealing, U.S. Equities Undergoing a Sector Rotation, International Markets (Again) Offer Better Value, Liquid Alternatives A Diversifier
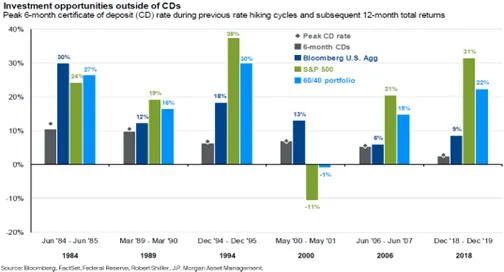
Ahead of the Fed’s tightening moves in 2023, we were rightfully skeptical of longer-term bonds and were underweight duration, which helped portfolios weather the impact of 2022’s awful year for fixed income. Cash-like instruments such as CDs, money-market funds, and shorter-term Treasury bills made sense over much of 2023, with yields in the 5%+ range, pushing such assets to a record $6 trillion. However, a dovish Fed has strengthened the case for reallocating away from them. Typically, when the Fed is in pause mode and is preparing the markets for rate cuts, it has paid to own either core bonds or equities in the years after the last rate hike since shorter-term cash instruments face greater re-investment risk in an easing cycle. The only exception to this over the past 40 years, as shown below, has been the period around the dot-com crash.
Accordingly, we favor adding to core bonds in the belly of the curve and have steadily increased the duration of our fixed-income portfolios relative to the Barclays U.S. Aggregate Bond index to lock in higher yields. While the Federal Reserve could always put rate hikes back on the table, should we encounter a resurgence of inflation as witnessed in the 1970s, it has usually been the case that after the Fed has been on pause for 7+ months, rate cuts are inevitable and hence favorable for bonds. Investors seem to agree. Per Morningstar, of the $95 billion that flowed into U.S. Mutual Funds and ETFs this year through February, bond funds accounted for a majority of the inflows, with stock funds suffering modest inflows. We continue to believe bonds offer better risk/reward than stocks; and we utilize the earnings yield (the inverse of the PE ratio) as a reliable gauge to determine which asset class offers better value. While the S&P 500 currently trades at 21 times forward earnings, which implies an earnings yield below 5%, core bonds offer similar yield with a lot less risk. Historically, when equities trade at a 20x+ forward PE (relative to the historical 16x median PE), 5-year forward returns have averaged 3% or lower. Within our diversified portfolios, we offer a healthy mix of equities, bonds and alternatives as an alternative to the industry standard 60/40 or balanced portfolio. With a more compelling risk versus reward across most global fixed income markets, investors now have the chance to build a robust globally diversified portfolio that balances capital appreciation and income goals.
Thus far this year, the equities rally in the U.S. has featured improving market breadth, with continued strength in 2023 market leaders such as Technology and Communication Services and a resurgence in 2023 laggards, specifically Financials and Industrials. In a sign of how relentless this market rally has been, it has been more than six months since we had the S&P 500 drop more than 2% on a single trading day. While last year’s equities run was primarily driven by an expansion of valuations, given almost flat earnings-per-share (EPS) growth, this year’s rally has been driven both by rising valuations and the expectation of positive revenue and EPS growth. As the past two quarters have shown, corporate EPS growth appears to have bottomed and most corporate CEOs and CFOs of large corporations have not sounded the alarm about imminent business and earnings erosion. Both the S&P 500 and the Nasdaq have surpassed all-time highs last seen in late 2021 and early 2022, but this has come despite recent participation from only half of the “Magnificent 7” stocks (Apple and Tesla have notably lagged while Meta, Microsoft, and Nvidia have hit all-time highs). Despite a 20% rally from November through year-end, small caps still trade at a cheap 14-15 times forward PE multiple relative to large caps. Typically, rate cuts bode well for this group, which typically has more levered balance sheets and hence has more to benefit from the availability of cheaper money. After a stellar 2023, we expect a more muted year for U.S. Equities. Should the Fed cut sooner than other global central banks resulting in a weaker dollar, that bodes well for International Equities.
With first quarter earnings season having nearly ended, consensus estimates call for 2024 Year-over-Year (YoY) earnings growth to be around 11% to $244, with Q1 YoY EPS growth projected to be 3%. While there has been widespread skepticism since 2023 about whether the FY24 earnings growth estimate is achievable, we believe it is if corporations can pass on price increases to consumers as long as balance sheets are healthy and can continue to cut costs (as they have in 2024), which should aid margin expansion. We remain agnostic between growth and value, given we see both early and late cycle market action; hence, we are keeping portfolios relatively style neutral with a bias toward large-cap. With the Fed potentially easing faster than other global central banks, we also see room for dollar weakness, which would put developed international markets (trading at a 20% discount to U.S. equity markets) and emerging markets (ex-China) as a worthy addition to our diversified portfolios. Admittedly, the past 10 years have been a tough stretch for Emerging Markets, given that China (which accounts for 30% of the MSCI EM indices) has been a huge laggard ever since markets there hit highs in 2007.
Finally, a word on Alternatives. Across our diversified portfolios, we have broad exposure to liquid alternatives (e.g. Hedged Equity, Global Infrastructure, Real Assets) all of which have the potential to lower overall portfolio volatility while enhancing returns2. For instance, a JP Morgan study shows over the past 30+ years, modifying a 60/40 portfolio to a 40% Equities/30% Fixed Income/30% Alternatives portfolio has the potential to slash portfolio volatility by a third, while modestly enhancing returns.2 While IPO, M&A, and real estate transactions slowed to a crawl in 2022 and 2023 and private market valuations, especially for venture-backed companies shrank, we believe these have the potential to turn alongside an improving economy which should aid categories such as venture capital and private equity. Given that the return dispersion between the top and bottom quartile managers in the alternatives universe can be much more significant than in public markets, we expect to spend more time on alternatives manager selection in the months ahead.
Stay tuned for our thoughts on these and other relevant market topics in the quarters ahead!
1The Atlanta Fed GDPNow estimate is a model-based projection not subject to judgmental adjustments. It is not an official forecast of the Atlanta Fed, its president, the Federal Reserve System, or the Federal Open Market Committee.
2Source: J.P. Morgan Asset Management, Alts, hedge funds and real estate.
Wealth Management does not provide accounting, legal or tax advice. This information discusses general economic and market activity and is presented for informational purposes only and should not be construed as investment advice. Views and opinions expressed herein do not account for any specific investment objective, restrictions, and/or financial circumstances of any specific client. Investors are urged to consult with their financial advisors before buying or selling any securities.
Different types of investments involve varying degrees of risk, and there can be no assurance that any specific investment will either be suitable or profitable for a client’s investment portfolio. The investment return and principal value of investment securities will fluctuate based on a variety of factors, including, but not limited to, the type of investment, amount and timing of investments, changing market conditions, currency exchange differences, stability of financial and other markets, and diversification. The statements and opinions expressed in this article herein are those of the author as of the date of the article and are subject to change. Content and/or statistical data may be obtained from public sources and/or third-party arrangements and is believed to be reliable as of the date of the article.
Products offered through Wealth Management are not FDIC Insured, are not bank guaranteed and may lose value.